Flare Probabilities [%] (00:00 UTC +24H) ?
| NOAA ? | C+ | M+ | X+ | Mean ? | ||||||||
|---|---|---|---|---|---|---|---|---|---|---|---|---|
| MCEVOL ? | MCSTAT ? | SWPC ? | MCEVOL | MCSTAT | SWPC | MCEVOL | MCSTAT | SWPC | C+ | M+ | X+ | |
| 13742 | 12 | 5 | - | 4 | 0 | - | 0 | 0 | - | 8 | 2 | 0 |
| 13743 | 11 | 9 | - | 3 | 0 | - | 0 | 0 | - | 10 | 2 | 0 |
| 13744 | 0 | 14 | 15 | 0 | 1 | 1 | 0 | 0 | 1 | 10 | 1 | 0 |
| 13745 | 30 | 14 | 15 | 3 | 1 | 1 | 0 | 0 | 1 | 20 | 2 | 0 |
| 13747 | 7 | 15 | 10 | 0 | 1 | 1 | 0 | 0 | 1 | 11 | 1 | 0 |
| 13748 | 9 | 5 | - | 0 | 0 | - | 0 | 0 | - | 7 | 0 | 0 |
| 13750 | 12 | 5 | - | 4 | 0 | - | 0 | 0 | - | 8 | 2 | 0 |
| 13751 | 92 | 92 | 85 | 32 | 35 | 35 | 3 | 5 | 10 | 90 | 34 | 6 |
| 13752 | 4 | 10 | 5 | 0 | 0 | 1 | 0 | 0 | 1 | 6 | 0 | 0 |
| 13753 | 19 | 22 | - | 1 | 2 | - | 0 | 0 | - | 21 | 2 | 0 |
| 13754 | 30 | 14 | 10 | 3 | 1 | 1 | 0 | 0 | 1 | 18 | 2 | 0 |
| 13755 | 19 | 22 | 15 | 1 | 2 | 1 | 0 | 0 | 1 | 19 | 1 | 0 |
| 13756 | 7 | 15 | 10 | 0 | 2 | 1 | 0 | 0 | 1 | 11 | 1 | 0 |
| 13757 | 7 | 15 | 20 | 0 | 2 | 5 | 0 | 0 | 1 | 14 | 2 | 0 |
| 13758 | 26 | 9 | - | 2 | 0 | - | 0 | 0 | - | 18 | 1 | 0 |
| 13759 | 27 | 33 | 30 | 3 | 4 | 5 | 0 | 0 | 1 | 30 | 4 | 0 |
| 13760 | 12 | 5 | 10 | 4 | 0 | 1 | 0 | 0 | 1 | 9 | 2 | 0 |
| 13761 | - | 57 | 50 | - | 6 | 10 | - | 0 | 1 | 54 | 8 | 1 |
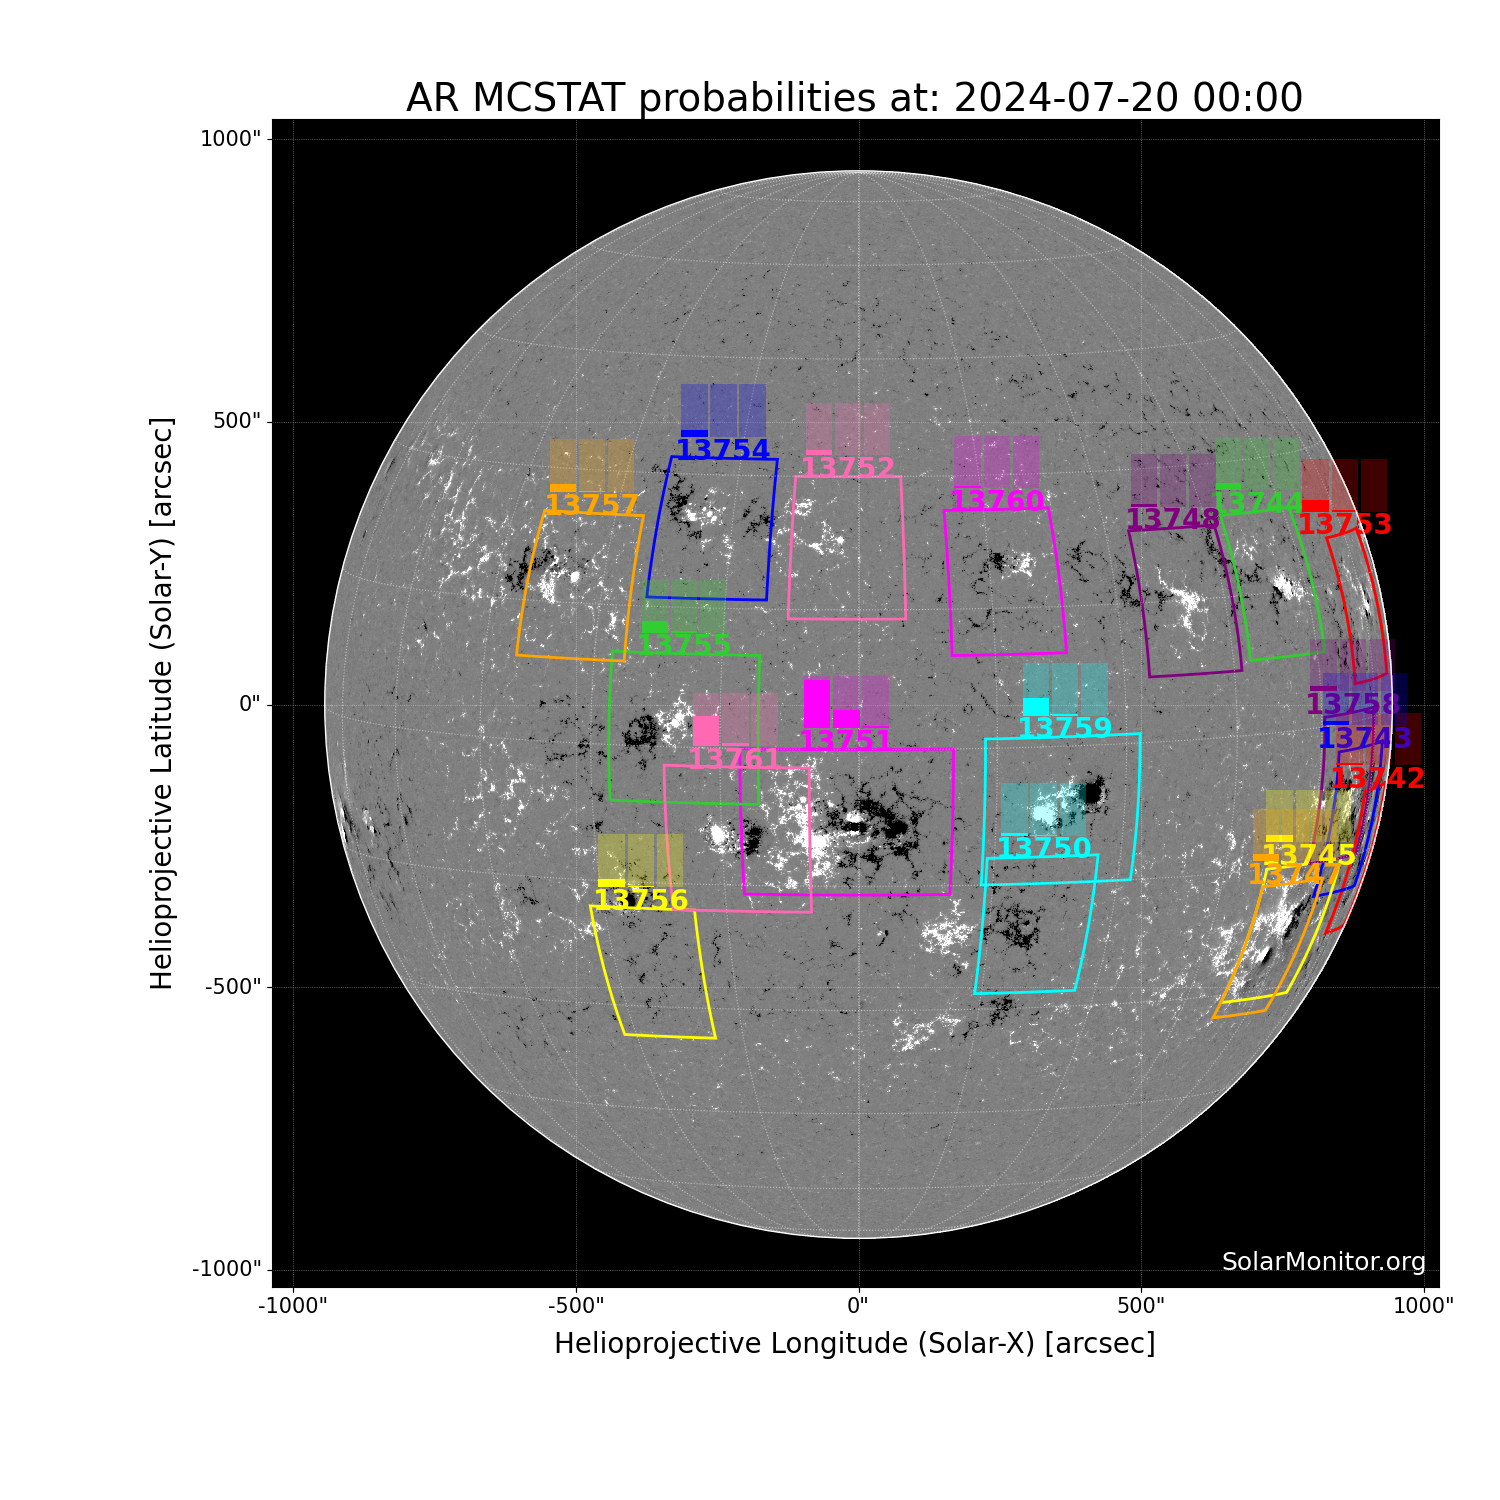
SolarMonitor's flare prediction system's probabilities are calculated using the NOAA Space Weather Predicion Centre's McIntosh classifications. There are two methods, MCSTAT and MCEVOL, that use sunspot-group McIntosh classifications and Poisson statistics to calculate flaring probabilities valid for a 24-hr period starting at 00:00 UTC. The flaring probabilities are calculated using historical data from solar cycles 23 and 24 (1996-2019).
MCSTAT (McIntosh Statistics): Uses the point-in-time McIntosh classification to calculate Poisson flaring probabilities. Details about the method [1] and forecast verification testing [2] can be found in the following papers:
[1] Gallagher, P. T., Moon, Y.-J., Wang, H., Solar Physics, 209, 171, (2002)
[2] Bloomfield et al., 2012, The Astrophysical Journal Letters, 747, L41
[1] McCloskey, A.E., Gallagher, P.T. & Bloomfield, D.S., Solar Physics, 291, 1711, (2016)